
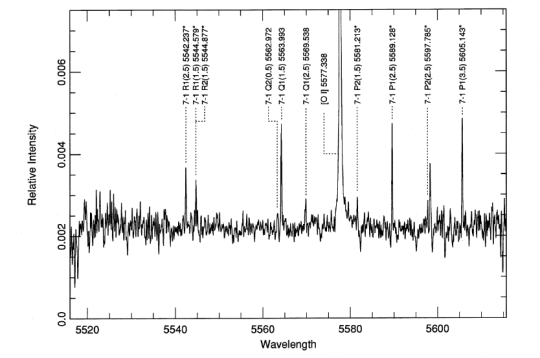
The above is a plot of the Wavelength(in Å) in the x-axis vs the flux of some objects from the Sloan digital survey ( consists of galaxies, young stars, Quasars, etc)
But there is one strong peak in all of those plots that seems to stand out: 5577 Å

And if you like, the color that it represents is the above (Made with Stanford’s color matcher app)
A nightmare for the astronomer

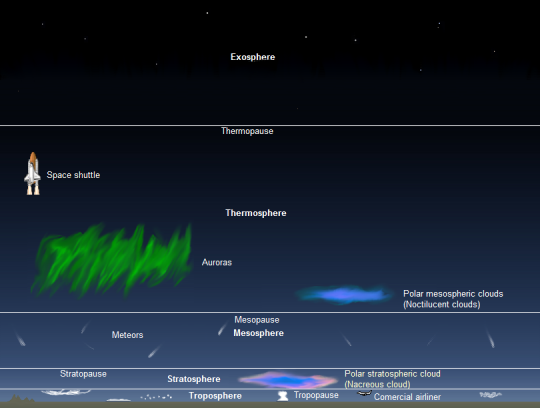
This line at 5577.338 is what astronomers refer to as a ‘skyline emission’ or a ‘mesospheric night-glow’ and arises from the recombination of atomic oxygen in the mesosphere.[2]
This line is of no significance to an astronomer who is looking to find out properties about a far away astronomical object. Yet, this line pops up in every spectrum of any object that you look at in outerspace!
In addition since the line is so strong, it contaminates the nearby pixels making the nearby data unusable and also messes up the scaling of the plot.
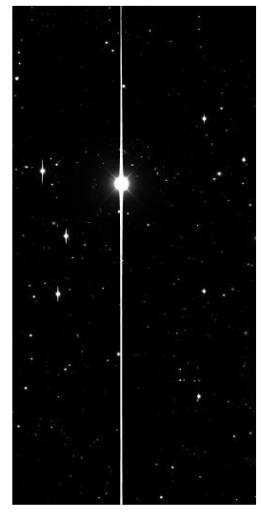
Example of contaminated pixel columns in an image because of bright object
Wavelength Calibration
What do you do with something that is always there but has no use for you? – Re-purpose it!
Having noticed that this peak was consistent at 5577.338, Astronomers decided that they would use this peak line in the data as a reference to calibrate their actual data. (known as ‘zero-point correction’).
This ensures that all the spectrum lines in the data are aligned and any errors that might have occurred during observation are corrected for.
Other lines ?
There are other lines at 6300,6363, etc which are sometimes as bright or brighter than the 5577 line that are also used for calibration.
If you are interested in learning more, the following are three papers that this post was inspired from and they dive deeper into more technical details that underlie this fascinating topic:
[2] Mesospheric nightglow spectral survey taken by the ISO Spectral Spatial Imager on ATLAS 1
[3] Variability of the mesospheric nightglow sodium D2/D1 ratio
Have a great day!

Pingback: List of atmospheric optical phenomenon - Keerthi Vasan GC